There are a number of ways that Iowa birders contribute to our knowledge over time
of the status of various species within our borders. Seasonal field reports,
published each quarter in Iowa Bird Life, create one picture of avian life.
While seasonal reports are extremely valuable, they are also somewhat biased by
a number of factors such as how many reporters there are in any given year, their
location within the state, and where they bird most frequently. A more scientific
approach to breeding birds was begun many years ago by the U.S. Fish & Wildlife
Service. These Breeding Bird Surveys are linear with observers recording numbers
of different species seen and heard within three minutes at half-mile stops along
a 25 mile route. They are run in June of each year, after migration is over,
and since the same routes are replicated year after year, variation in numbers give
an indication of species status and health over time.
While both methods described above are important, they do not always give us the
more in depth information on success of nesting and the habitats important to that
success. Enter the Breeding Bird Atlas projects that have been carried out
throughout the country. Atlas projects survey standardized areas and record
levels of evidence of breeding as well as some habitat information. States
establish their own rules for how these areas, or blocks, are determined to get
the best representation of the health of breeding birds within the state.
The Iowa Process
 Beginning in late fall 2007, the Iowa BBA committee began a number of lengthy discussions
about how to create a scientifically valid sample of blocks that might reasonably
receive 20 hours of effort over the course of five years. Because Iowa has
so much land in crop production, a totally random block selection would be weighted
heavily toward row crops, not exactly the best habitat for most breeding birds.
Consequently the first decision was to sample an equal number of grid-based blocks
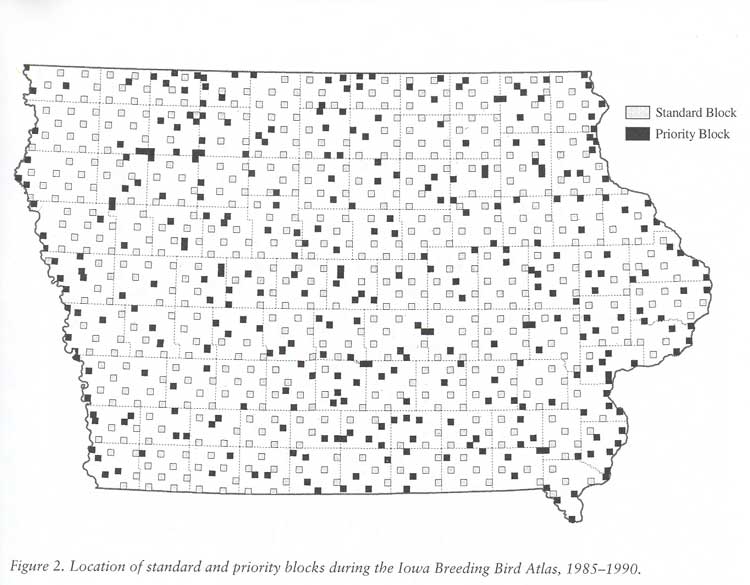
and habitat-based blocks. This is not dissimilar to the selection process
in the first Iowa atlas project (see map above) although there were 522 grid and
339 priority blocks in BBA I. The major difference is that today we have many
new tools available, such as GIS habitat mapping, to make the selection of habitat
blocks more random and scientific than could be done twenty years ago. When
this same randomization is applied in another twenty years, there should be comparable
data to paint an accurate picture of what is happening to the bird life across the
state. The atlas is intended to paint with a broad stroke. We already
know what happens to grassland species when a particular piece of land is plowed
for corn production or even mowed heavily. The bigger picture will tell us
how a species is faring within the habitat still available to it. Combined
with other studies of habitat change over time, we should get a pretty decent picture
of how Iowa is looking overall. As a point of reference, this chart shows
that the Iowa landscape does not have a whole lot of this habitat left.
Beginning in late fall 2007, the Iowa BBA committee began a number of lengthy discussions
about how to create a scientifically valid sample of blocks that might reasonably
receive 20 hours of effort over the course of five years. Because Iowa has
so much land in crop production, a totally random block selection would be weighted
heavily toward row crops, not exactly the best habitat for most breeding birds.
Consequently the first decision was to sample an equal number of grid-based blocks
and habitat-based blocks. This is not dissimilar to the selection process
in the first Iowa atlas project (see map above) although there were 522 grid and
339 priority blocks in BBA I. The major difference is that today we have many
new tools available, such as GIS habitat mapping, to make the selection of habitat
blocks more random and scientific than could be done twenty years ago. When
this same randomization is applied in another twenty years, there should be comparable
data to paint an accurate picture of what is happening to the bird life across the
state. The atlas is intended to paint with a broad stroke. We already
know what happens to grassland species when a particular piece of land is plowed
for corn production or even mowed heavily. The bigger picture will tell us
how a species is faring within the habitat still available to it. Combined
with other studies of habitat change over time, we should get a pretty decent picture
of how Iowa is looking overall. As a point of reference, this chart shows
that the Iowa landscape does not have a whole lot of this habitat left.
|
Open Water
|
.88%
|
|
Wetlands
|
.51%
|
|
Wet Forest/Bottomlands
|
.19%
|
|
Deciduous Forest
|
7.51%
|
|
Ungrazed Grasslands
|
18.06%
|
Grid Block Selection - 395 Blocks
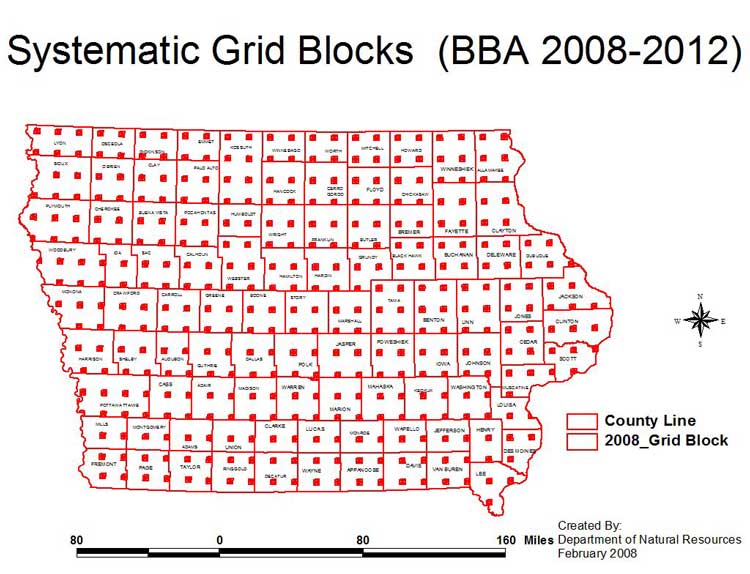 395 blocks are systematically placed across the state in 3 mile by 3 mile squares.
Some of these may chance upon public lands while others will be all privately owned.
A few blocks at either side of the state may be less than 3x3 because our border
rivers just don't run straight, but each county has roughly a minimum of 18
square miles of grid blocks to be surveyed. It should be noted that because
the sample is now divided evenly, the number of grid-based blocks dropped from the
first BBA. Rather than replace grid blocks with habitat blocks in some areas,
this group was held sacred and placed first so there is not a block to block comparison
to BBA I. See the map of the grid block distribution.
395 blocks are systematically placed across the state in 3 mile by 3 mile squares.
Some of these may chance upon public lands while others will be all privately owned.
A few blocks at either side of the state may be less than 3x3 because our border
rivers just don't run straight, but each county has roughly a minimum of 18
square miles of grid blocks to be surveyed. It should be noted that because
the sample is now divided evenly, the number of grid-based blocks dropped from the
first BBA. Rather than replace grid blocks with habitat blocks in some areas,
this group was held sacred and placed first so there is not a block to block comparison
to BBA I. See the map of the grid block distribution.
Habitat Block Selection - 396 Blocks
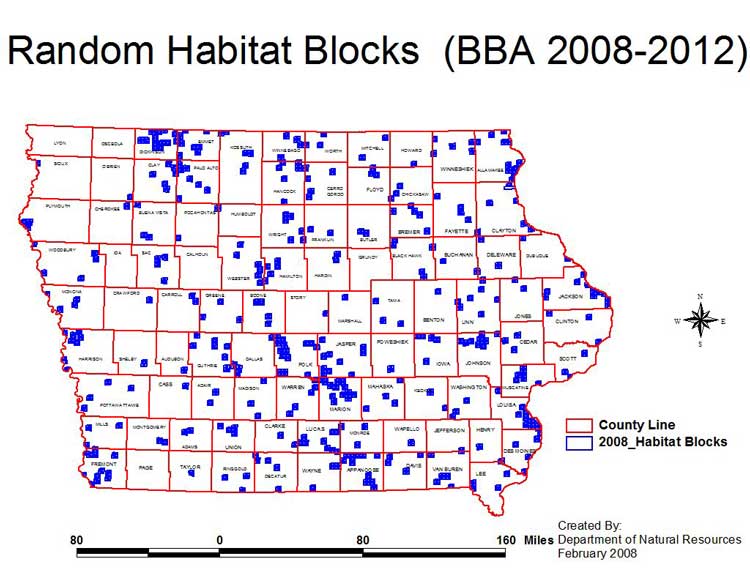 Placing a block every few miles west to east and north to south was the easy part.
Creating a methodology for habitat block selection, which could be replicated in
coming years, took a lot of careful thought. The specific areas were
not important but representative habitat was critical. The committee remained
steadfast in the randomization of this selection and agreed to selection rules before
ever knowing what properties would be selected. The rules are as follows:
Placing a block every few miles west to east and north to south was the easy part.
Creating a methodology for habitat block selection, which could be replicated in
coming years, took a lot of careful thought. The specific areas were
not important but representative habitat was critical. The committee remained
steadfast in the randomization of this selection and agreed to selection rules before
ever knowing what properties would be selected. The rules are as follows:
- Sample size is all public lands. The sample is stratified north and south to create
a more even distribution. Thus, half of the 396 habitat blocks are in northern
Iowa and the other half in southern Iowa.
- Tracts of land for selection and block placement are defined by the GIS public lands
database. Large public areas may contain a number of different tracts managed by
different entities; i.e., Army Corps of Engineers, state park, county park, state
wildlife area.
- To be considered for selection, a public land site must contain a minimum
of 40 contiguous acres of habitat.
- The percent of habitats in protected lands in the state is 1) wet forest/bottomlands
(2.9%), 2) wetlands (7.3%), 3) grasslands (25.1%), 4) open water (26.9%) and 5)
deciduous forest (37.9%). The percentage of blocks based on each habitat
was similar, although most blocks contain more than one habitat type. The
396 habitat sites were drawn by rotating through the habitat types from smallest
to largest percent in order to be sure all habitats were represented. Once all the
blocks were selected for a particular habitat type it was no longer included in
the rotation.
- Using the above methodology the total number of sites selected by habitat, with
half of the sites in the north and the other half in the south, are: 1) wet forest/bottomlands
- 12, 2) wetlands - 28, 3) grasslands - 100, 4) open water
- 106 and 5) deciduous forest - 150.
- Each public property was analyzed with GIS information and weighted by the acreage
of each of the above habitats contained therein. Consequently, a large area
with numerous types of habitats had a much higher probablity of being drawn than
a single 40 acre deciduous forest. The important concept was covering critical
habitats, not particular properties.
- There is no minimum or maximum number of blocks for a property. Everything
is random.
- Placement of the first randomly-drawn block for a property is centered on the property.
Subsequent blocks are placed based on remaining habitat, if available.
- If a habitat block overlaps a grid block, that selection is moved if it is possible
to maintain the same habitat type or set aside and another one drawn.
- Habitat blocks that cross state boundaries are moved if possible or truncated to
the extent necessary to keep the block entirely within Iowa. At least half
of the nine square miles must remain or that selection will be excluded and another
drawn.
- All block placements using these rules were done by someone unfamiliar with
Iowa birds to keep the process as objective as possible.
With a solid scientific methodology and committee agreement, the blocks were created.
Not surprisingly, the clustering is very similar to the clustering of protected
lands. See the map of habitat block distribution.
The Final Product
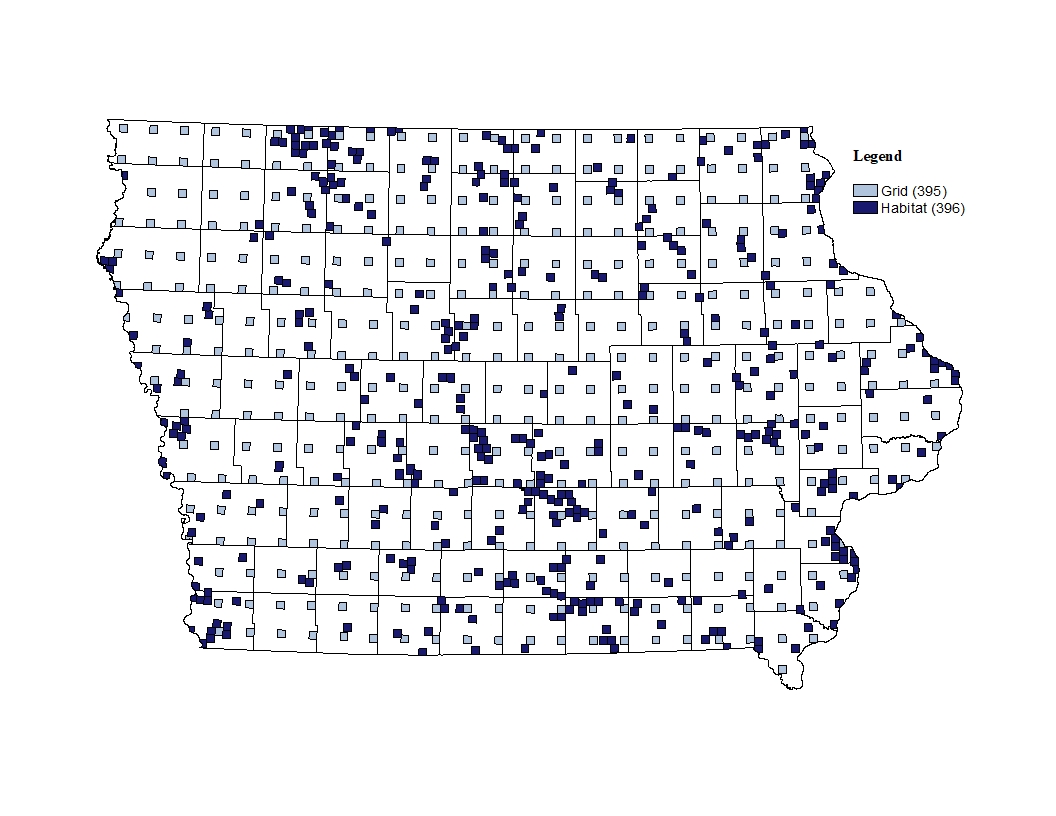 While some may be disappointed that their favorite birding area was not drawn in
the selection process, the sample for this BBA should provide some good data for
analysis now and in the future. Most likely the map will look a bit different
in another 20 years but comparing species by habitats should be similar. Will
we miss a species or two along the way? Probably, but the point is not to
replicate what we already know. Iowa has been very fortunate throughout the
last century to have dedicated birders and ornithologists documenting the existence
of breeding species. We must also look critically at the effects of change
over time and this project gives us that opportunity.
While some may be disappointed that their favorite birding area was not drawn in
the selection process, the sample for this BBA should provide some good data for
analysis now and in the future. Most likely the map will look a bit different
in another 20 years but comparing species by habitats should be similar. Will
we miss a species or two along the way? Probably, but the point is not to
replicate what we already know. Iowa has been very fortunate throughout the
last century to have dedicated birders and ornithologists documenting the existence
of breeding species. We must also look critically at the effects of change
over time and this project gives us that opportunity.
View all sampling sites on interactive map
 Download final map